- Creating Your First Action
- Creating Your First Connector
- Creating Your First Data Parser
- Developing Actions
- Creating Your First Action
- Concepts & Best Practices
- Coding Execute Operations
- Coding Variables
- Coding Input Prompt Operations
- Authenticating Actions
- Developing Connectors
- Creating Your First Connector
- Authenticating Connectors
- Reference: Data Connectors
- Extending Slack
- Overview
- Quickstart
- Slack Slash Commands
- Slack Bots
- Workflows with Slack
- Notifications with Slack
- References
- Developer Platform Glossary
- Python and SQL Operations
- Python Operations
- JavaScript Operations
- SQL Operations
- Block Kit Library
Receiving Datadog Monitor Alerts
Here's how to set up a webhook to receive Datadog monitor alerts in Transposit.
Once configured, you can:
- route Datadog monitor alerts Transposit and Slack
- create activities and run runbooks tied to Datadog monitor alerts
- trigger runbooks to run when Datadog monitor alerts are received
- trigger runbooks to run when the payload's content matches your conditions
- trigger runbooks to run when an activity is created in response to Datadog monitor alerts
- invoke actions to remediate the underlying issues triggered by Datadog monitor alerts
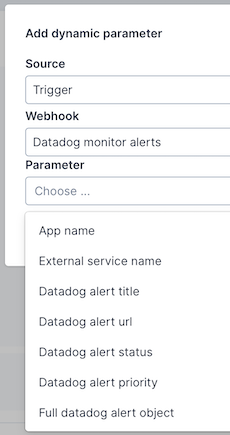
- set dynamic parameters using payloads provided by Datadog monitor alerts
Follow the steps below to integrate Datadog monitor alerts with Transposit.
1. Create Datadog Monitor Alert Webhooks in Transposit#
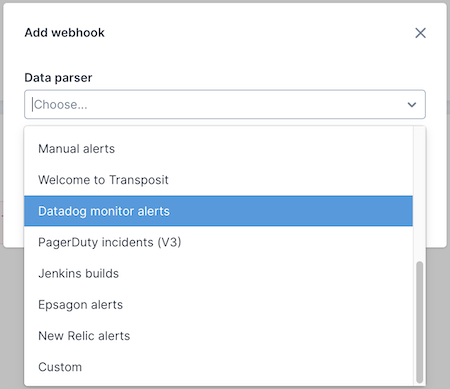
Go to Settings > Webhooks, and click Add webhook. Choose Datadog monitor alerts, as shown below.
Note: The optional Slack channel must already exist, create it before adding the webhook.
Click Add and then find the webhook you just added in the list. Click Click to copy to copy the URL to the clipboard or manually copy the endpoint URL.
2. Set Up Webhooks in Datadog#
Follow the "Webhooks Integration" instructions on the Datadog site and create a webhook, as shown below.
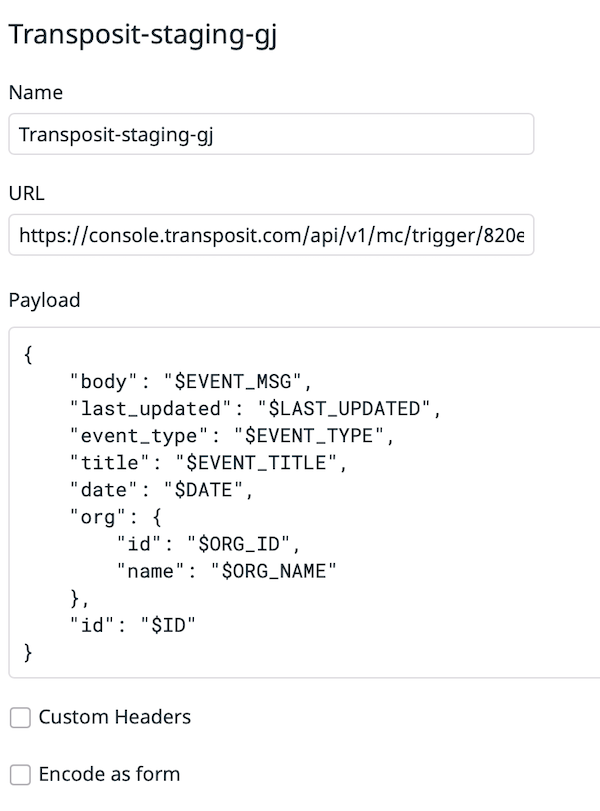
Replace the payload above with the below so that Transposit will be able to provide a more expressive visualization in Slack and in Transposit when Datadog monitor alerts are received.
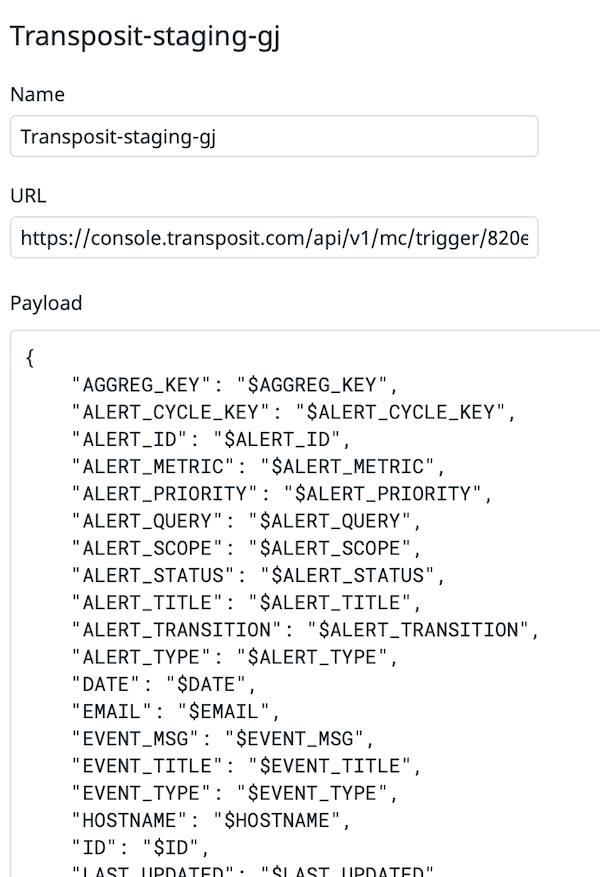
{ "AGGREG_KEY": "$AGGREG_KEY", "ALERT_CYCLE_KEY": "$ALERT_CYCLE_KEY", "ALERT_ID": "$ALERT_ID", "ALERT_METRIC": "$ALERT_METRIC", "ALERT_PRIORITY": "$ALERT_PRIORITY", "ALERT_QUERY": "$ALERT_QUERY", "ALERT_SCOPE": "$ALERT_SCOPE", "ALERT_STATUS": "$ALERT_STATUS", "ALERT_TITLE": "$ALERT_TITLE", "ALERT_TRANSITION": "$ALERT_TRANSITION", "ALERT_TYPE": "$ALERT_TYPE", "DATE": "$DATE", "EMAIL": "$EMAIL", "EVENT_MSG": "$EVENT_MSG", "EVENT_TITLE": "$EVENT_TITLE", "EVENT_TYPE": "$EVENT_TYPE", "HOSTNAME": "$HOSTNAME", "ID": "$ID", "LAST_UPDATED": "$LAST_UPDATED", "LINK": "$LINK", "LOGS_SAMPLE": "$LOGS_SAMPLE", "METRIC_NAMESPACE": "$METRIC_NAMESPACE", "ORG_ID": "$ORG_ID", "ORG_NAME": "$ORG_NAME", "PRIORITY": "$PRIORITY", "SNAPSHOT": "$SNAPSHOT", "TAGS": "$TAGS", "TEXT_ONLY_MSG": "$TEXT_ONLY_MSG", "USER": "$USER", "USERNAME": "$USERNAME" }
For an explanation of the variables above, see the Datadog Webhook documentation.
The payload should now be structured as below.
3. Trigger Monitor Alerts in Datadog#
Create a new monitor in Datadog, as shown below.
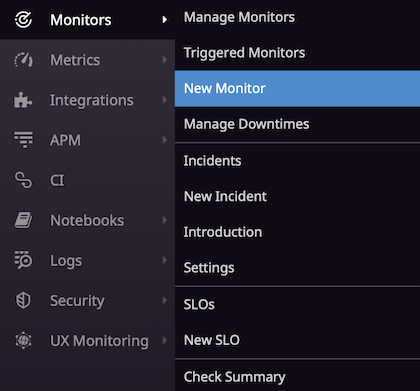
When you are defining the monitor, use the name of the Datadog webhook you defined above, as shown below, in the format @webhook-<WEBHOOK_NAME>, in the monitor definition.
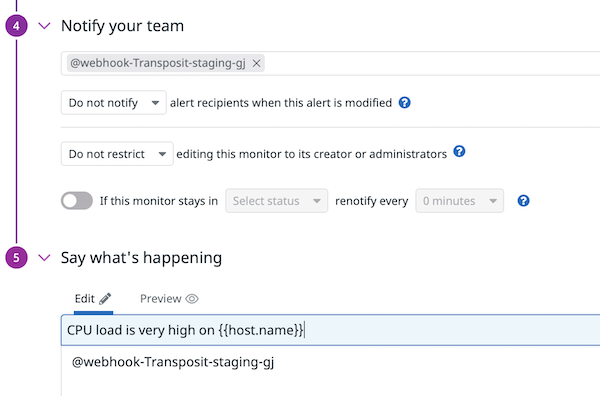
For reference, see the Datadog Webhook documentation, in particular the following:
To use your webhook, add @webhook-<WEBHOOK_NAME> in the text of the metric alert you want to trigger the webhook.
4. Integrate Datadog Monitor Alerts in Transposit#
When a Datadog monitor is triggered, you should see Datadog monitor alerts displayed as events in Transposit, as shown below.
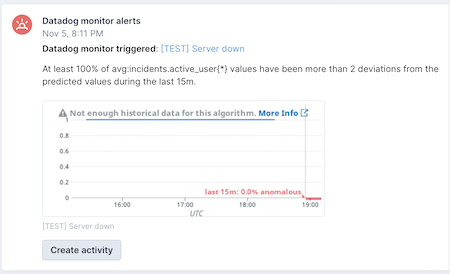
In Slack, if you defined the webhook in Transposit to support Slack, you should see Datadog monitor alerts displayed, too, as shown below.
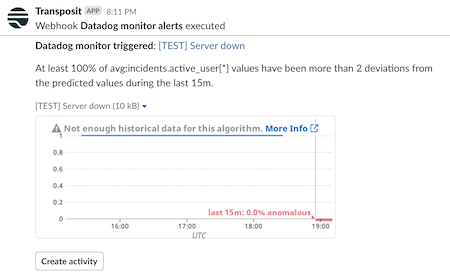
- When an alert is received, click Create activity, as shown above, to create a new activity, adding runbooks, and following the progress of work done by your team in response to Datadog monitor alerts.
- If you have added runbook triggers, one or more runbooks will start automatically when a Datadog monitor alert is received.
- If you have defined dynamic Datadog monitor alert parameters while adding runbook actions, as shown below, their values will be populated by the Datadog monitor alert's payload when the actions are executed during runbook runs.
