The Mysterious Case of the Bad Gateway (502)
With very few clues to hand, I began an investigation to chase down navigation failures with API requests occasionally returning HTTP 502 Bad Gateway.
Transposit is building an in-browser IDE for prototyping and then deploying data-driven applications. A few months ago, we started to see sporadic navigation failures in our webapp because API requests occasionally returned with HTTP 502 Bad Gateway. These failures proved to be very elusive: they were not associated with any API in particular and they always disappeared if you retried navigation. With very few clues, I began an investigation.

Eliminating the usual suspects#
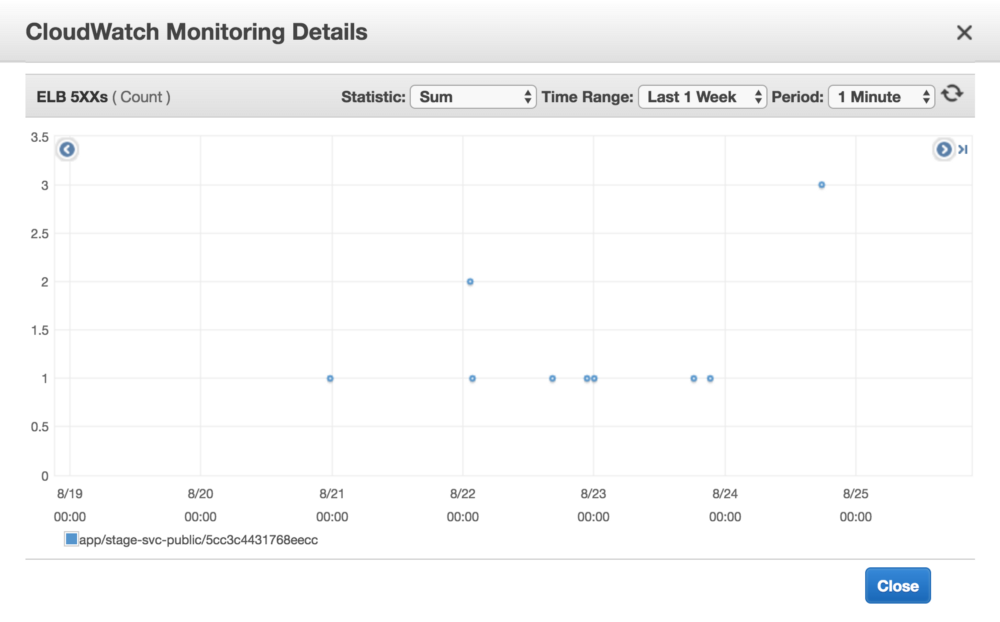
HTTP 502 Bad Gateway indicates a problem between a proxy service and its target. We use an AWS Application Load Balancer (ALB) as a proxy to our API service, so I started there. The CloudWatch metrics confirmed it was indeed the source of the responses.

Alright, why does an ALB respond 502? A search for “alb 502” yielded mildly helpful AWS documentation. ALBs might respond with 502 for a large variety of reasons, including: the target responded with malformed HTTP, the target did not respond, and the target was never successfully reached to issue a request.
Which problem was our problem? I took the time to turn on more verbose logging in hopes that I could narrow my investigation. All I got was this:
h2 2018-08-28T20:17:23.366947Z app/stage-svc-public/XXXXXXXXXXXX 136.25.190.44:52430 172.16.43.250:34889 0.001 0.012 -1 502 - 87 610 "GET https://console.transposit.com:443/api/v1/keychains/jplace/test/context HTTP/2.0" "Mozilla/5.0 (Macintosh; Intel Mac OS X 10_13_4) AppleWebKit/537.36 (KHTML, like Gecko) Chrome/68.0.3440.106 Safari/537.36" ECDHE-RSA-AES128-GCM-SHA256 TLSv1.2 arn:aws:elasticloadbalancing:us-west-2:966705841376:targetgroup/stage-web/be9bc8c7b74c0e63 "Root=X-XXXXXXXX-XXXXXXXXXXXXXXXXXXXXXXXX" "console.transposit.com" "arn:aws:acm:us-west-2:XXXXXXXXXXXX:certificate/XXXXXXXX-XXXX-XXXX-XXXX-XXXXXXXXXXXX" 0 2018-08-28T20:17:23.353000Z "forward" "-"
I’ll save you the time of parsing this log: it contains no new information. The log confirms that the ALB responded 502 because it never parsed a HTTP response. But, did it even receive a response of any kind? Did it even connect and send a request? These logs were as deep I could dig into ALB internals, so I moved on.
Next, I quickly checked our API service for some of the “usual suspects” of failure. Maybe our API service was unresponsive because it overwhelmed its allocated resources? I checked CPU and memory usage and everything looked fine. Maybe our API service severed connections because it was crashing? Logs indicated our services were staying up as expected. Maybe our deployment process disrupted outstanding ALB requests? Deployments did not correlate with the timings of the 502s.
More sophisticated debugging work loomed. I considered tracing HTTP traffic between our API service and the ALB. However, if I couldn’t reliably reproduce the 502, I didn’t think this trace would be very useful. I also had only novice experience with network debugging tools so I would need significant time to ramp up. I wanted a quicker path to resolution.
An Unusual Suspect#
As I discussed my options with a coworker, they gave me a lucky break: maybe the start of this problem coincided with upgrading Dropwizard a couple months ago? Dropwizard is the basis of our API service, so I could see how changing it could affect ALB connections.
I searched more specifically for HTTP 502s associated with Dropwizard, and quickly found a recent Dropwizard issue describing symptoms similar to ours. I had not found it before because the issue was about NGINX as a proxy, not AWS ALBs.
In early engagement on the issue, people were as confused as I was by these 502s. Luckily, the most recent posts included some critical discoveries. First, new versions of Dropwizard had started setting the TCP backlog length to an OS default value. Second, when Dropwizard read OS default values, it sometimes only read the first digit of them. On machines with a default TCP backlog length of 128, Dropwizard was setting the backlog length to just 1. Oh my.
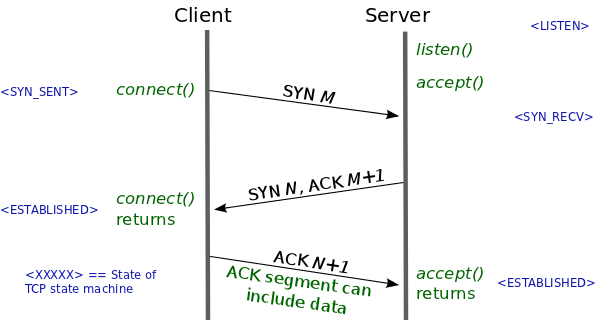
Wait, what is the TCP backlog? An application wishing to accept incoming TCP connections must issue the listen syscall. This syscall instructs the OS to proceed with the TCP 3-way handshake when it receives initial SYN packets. During a handshake, metadata for a connection is maintained in a queue called the TCP backlog. The length of this queue dictates how many TCP connections can be establishing concurrently. The application issues accept syscalls to dequeue connections once they are established; this action frees space in the backlog for new connections.
A backlog length of 1 means the queue will be full while just a single connection is establishing and then waiting to be dequeued. When the queue is full, the OS will drop initial SYN packets from other new connections. A client will resend an initial SYN packet if it doesn’t receive a response, but after a couple attempts, it will stop and report failure to connect.

(If you are interested in network syscalls, I highly suggest Beej’s Guide to Network Programming. If you want to know more about the TCP backlog, I found this explanation extremely helpful.)
Why would setting the backlog length to 1 occasionally result in HTTP 502s? Most of the time, there are already established connections between the ALB and our API service, so the backlog length does not matter. However, when our service is unusually idle or is about to be upgraded, these connections are closed. A burst of API requests from just a single client at this point could cause the ALB to attempt to establish new TCP connections concurrently. Contention for the single slot in the TCP backlog would cause some of these connections to eventually report failure. The ALB responds to this failure by returning HTTP 502.
Debugging with hindsight#
I realized I could test whether a small TCP backlog was indeed our issue. I rebooted our API service so that already established connections between the service and the ALB would be closed. I then made 5 concurrent API requests against the ALB by loading a particularly busy page of our webapp. It worked! One of the 5 API requests responded with a HTTP 502. I ran this test twice more and found the 502 reproduced reliably.
I also realized I could confirm the backlog length was the issue by tracing network syscalls on the API service. I initially tried using strace to print the backlog value from Dropwizard’s listen syscalls, but I had trouble attaching the tool to the process. I turned to sysdig to trace syscalls across the entire machine, which was much better for our containerized environment. When I looked for listen syscalls, I found us specifying a backlog length of 1 as I expected:
$ sudo sysdig evt.type=listen
374105 20:45:20.363358501 0 docker-proxy (6145) > listen fd=4(<2t>family 10) backlog=128
374106 20:45:20.363360621 0 docker-proxy (6145) < listen res=0
381195 20:45:20.408528453 1 docker-containe (5443) > listen fd=18(<u>) backlog=128
381196 20:45:20.408529437 1 docker-containe (5443) < listen res=0
1620138 20:45:24.665423300 1 java (6247) > listen fd=28(<2t>0.0.0.0:8080) backlog=1
1620139 20:45:24.665425837 1 java (6247) < listen res=0
1620291 20:45:24.666136913 1 java (6247) > listen fd=31(<2t>0.0.0.0:8081) backlog=1
1620292 20:45:24.666138372 1 java (6247) < listen res=0
Using sysdig got me thinking more about how I might have found this root cause myself. A good start would have been to use tcpdump to trace the network traffic between the ALB and our API service and then explore this trace in Wireshark. In a capture associated with the 502, I would’ve seen the HTTP request was never being successfully sent and maybe even realized the underlying TCP connection was failing to establish. Hopefully, this would have led me to look at the network syscalls being issued by Dropwizard.
 Jordan Place · Sep 14th, 2018